
To take the blindfold off, you don't need magic. You just need two free, powerful tools from Google: Google Analytics 4 (GA4) and Google Search Console (GSC). Before diving into the numbers, it's also worth ensuring your technical foundation is solid by understanding Google Core Web Vitals.
Think of them as your store's security cameras and customer surveys combined. Google Analytics tells you who is inside your store and what they are touching. Search Console shows you the street outside—how people found your shop window and what made them decide to come in (or keep walking).
This guide will walk you through how to use both to turn raw numbers into a clear story about your business.
At a Glance: The Essentials
What tools do I actually need?
The foundation of everything is the duo of Google Analytics 4 (GA4) and Google Search Console (GSC). GA4 tracks behavior after someone clicks on your site (time spent, buttons clicked, purchases). GSC tracks visibility before they click—how you appear in Google Search results. Together, they show the full journey from a search query to a loyal customer. If your data reveals you're barely getting any traffic at all, you might want to review the 10 reasons why you might be invisible on Google and how to fix them.
What metrics actually matter in Search Console?
Focus on the "Big Four":
- Impressions: How many times your site appeared on a screen.
- Clicks: How many people actually visited.
- CTR (Click-Through Rate): The percentage of people who saw you and clicked.
- Average Position: Where you rank in the list.
Pro tip: If Impressions are high but Clicks are low, your "shop window" (Title and Description) might need a makeover.
Why are my Impressions going up, but Clicks going down?
Don't panic—this is the new normal. It’s often due to AI Overviews and features like "People Also Ask." Google is now answering questions directly on the search page. Your site gets credit for being there (Impression), but the user doesn't need to click to get the answer. It’s not a glitch; it’s a shift in user behavior. Navigating this specific shift requires a solid grasp on how to survive and rank in the era of generative search.
How do I fix a low Click-Through Rate (CTR)?
You need to be more "clickable." Spruce up your Titles and Meta Descriptions. Use Schema (structured data) to get those fancy stars or recipe cards in search results. Also, look for keywords where you have high visibility but low traffic—these are your biggest opportunities for quick wins.
How do I track social media properly?
You need "luggage tags" for your links. These are called UTM parameters. Without them, traffic from Facebook or LinkedIn often looks like "Direct" traffic, and you lose the data. Connect everything to Google Looker Studio to see the full picture in one place.
Table of contents
- Step 1: Laying the Foundation
- Step 2: The "Pre-Click" Story (Search Console Analysis)
- Step 3: The "Post-Click" Story (GA4 Analysis)
- Step 4: The "Viral" Story (Social Media)
- Step 5: The Cycle of Continuous Optimization
Step 1: Laying the Foundation
Before you can play detective, you need to set up your equipment.
Install Google Analytics 4 (GA4)
This is your main surveillance system. GA4 is different from the old versions—it doesn’t just count "visits"; it tracks "events." Did they scroll? Did they watch a video? Did they fill out a form? This shifts the focus from quantity of traffic to quality of engagement.
Configure Google Search Console (GSC)
You need to prove to Google that you own the site. Once you verify ownership, GSC opens the door to data you can’t get anywhere else: the actual search terms people type to find you. To ensure GSC is pulling all your latest pages effortlessly right from the start, check out how the modern sitemap in practice helps Google discover your portal.
The Critical Step: Connect Them!
You must link your GSC account to your GA4 account. If you don't, you have two separate datasets that don't talk to each other. By linking them in the GA4 admin panel, you unlock powerful reports that show you exactly which keywords lead to which user behaviors.
Step 2: The "Pre-Click" Story (Search Console Analysis)
Now that you're set up, let's look at the street outside your store. How do you look in the search results?
The Four Pillars of Visibility
In the "Performance" report, you'll see:
- Impressions: The potential reach. Note: If a user loads page 1 of Google and you are at the bottom, that counts as an impression, even if they didn't scroll down to see you.
- Clicks: The real visitors. Compare this number with your "Organic Sessions" in GA4. If GSC says you have 1,000 clicks but GA4 says only 200 sessions, you have a technical problem (your site might be loading too slowly). A clean, logical website helps turn those impressions into clicks—take a look at site structure optimization to build an architecture that Google loves to shore up that foundation.
- CTR: This measures how tempting your offer is.
- Average Position: Be careful with this average. Being #1 for a tiny keyword and #100 for a huge keyword averages out to #50, which doesn't tell the whole story. Always filter by specific queries.
Level Up: Finding Patterns with "Regex"
Want to look like a pro? Use Regular Expressions (Regex) in your filters. It sounds complex, but it's just a way to ask smarter questions.
- Brand Check: If your brand is "FastRun," people might type "Fast Run," "fastrun," or "Fast-Run." You can use a filter like fastrun|fast run (the pipe symbol | means "OR") to capture all variations at once.
- User Intent: Want to know what questions people are asking? Filter queries that contain how|what|why|when. This instantly shows you if your educational content is working.
The "Zero-Click" Reality
We mentioned this earlier, but it’s vital: The game has changed. AI and rich snippets mean users often get their answer without visiting your site.
Does this mean your SEO is failing? No. It means you are building brand authority. If Google trusts your content enough to show it as the answer, users will eventually learn to trust your brand, too.
Improving Your "Shop Window"
To get more clicks:
- Write Magnetic Titles: Use numbers, power words, or questions. "5 Ways to..." usually beats "How to..."
- Optimize Descriptions: Treat the meta description like a tweet—short, punchy, and with a call to action.
- Check your URL: domain.com/red-shoes is trustworthy. domain.com/p=123? looks suspicious. For a deeper dive into crafting the perfect links, read the ultimate guide to URL structure for SEO.
Step 3: The "Post-Click" Story (GA4 Analysis)
The customer has entered the building. What are they doing?
Finding the Data
Go to Reports > Acquisition > Traffic Acquisition. Look for Organic Search.
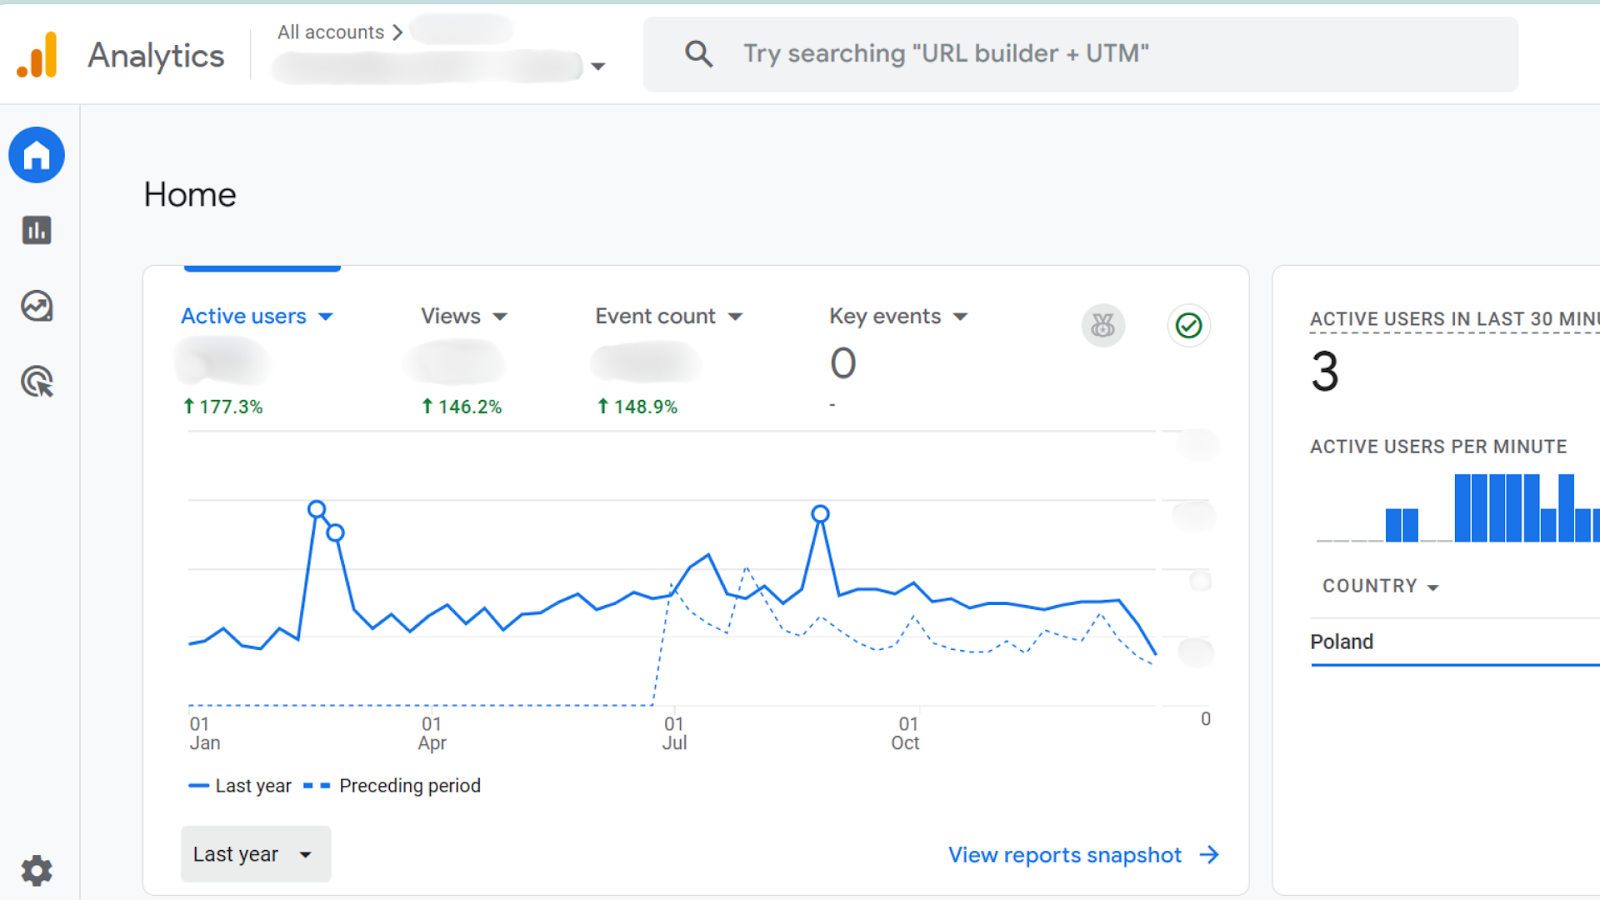
- Deep Dive: Change the primary dimension to "Session Source/Medium" to see exactly where they came from (e.g., Google, Bing).
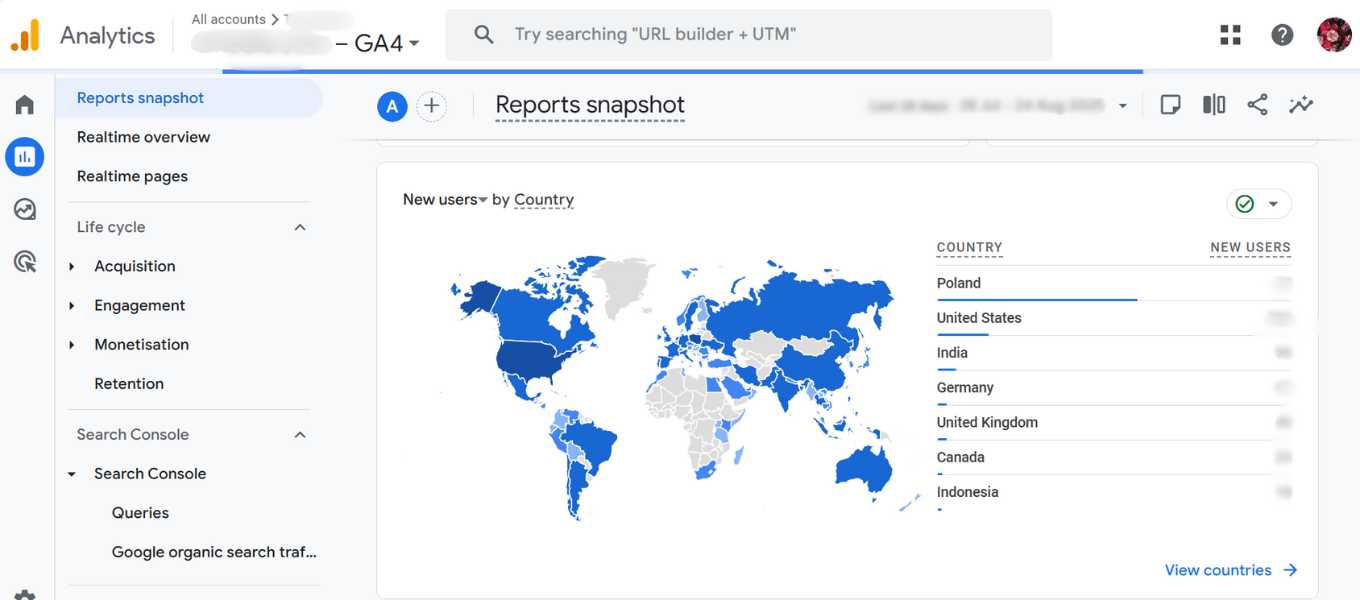
- Content Check: Add a secondary dimension called "Landing Page" to see which articles are your biggest magnets. You can also visualize where your users physically are located to better understand your market. If you regularly buy placements on other sites to draw users in, it's vital you know what SEO metrics like Ahrefs DR and Majestic TF actually mean when buying sponsored articles.
The Metric That Matters: Engagement
Forget "Bounce Rate." The new star is Engagement Rate.
A session is considered "engaged" if the user:
- Stays for more than 10 seconds, OR
- Converts (buys/signs up), OR
- Views at least 2 pages.
This is a much healthier way to measure interest. If you have a blog post where people read for 5 minutes and then leave, Bounce Rate would have called that a "failure." Engagement Rate correctly identifies it as a "success."
Key Events (Conversions)
Ultimately, traffic is vanity if no one buys or signs up. You must set up "Key Events" (formerly Conversions) to track the actions that pay the bills. This helps you understand which blog posts are just for reading and which ones actually drive business. If some of those posts are paid placements, you'll definitely want to know how to write a good sponsored article that naturally converts. And to protect your SEO efforts on those pieces, mastering the canonical tag in sponsored content is an absolute must.
Bonus Level: Chat with Your Data (MCP)
If the GA4 interface feels like a cockpit you don't know how to fly, there is a new solution: MCP (Model Context Protocol).
Google recently released an MCP server for Google Analytics. This allows you to connect GA4 directly to AI agents like Claude or ChatGPT.
- The Benefit: Instead of hunting for reports or building complex filters, you can simply ask natural questions: 'Which blog post topic groups drive the most traffic?' or 'How should I optimize my marketing budget?'. It’s perfect for getting actionable business insights without needing to be a data nerd.
- The Catch: The setup is technical. It involves connecting GA4 to Google Cloud, editing configuration files, and working with hidden folders. Expect to spend 1-2 hours setting it up, but the ability to talk to your data is worth the effort. If you're already familiar with AI prompting, these tools feel incredibly intuitive. Just remember the 10 things you should know about ChatGPT before writing articles or analyzing complex data sets.
Step 4: The "Viral" Story (Social Media)
Google isn't the only way people find you. But social media traffic is notoriously hard to track because apps often strip away data.
The Secret Weapon: UTM Parameters
If you post a link on Facebook without a tag, GA4 often shrugs and puts it in the "Direct" bucket (which basically means "I don't know").
Use a Campaign URL Builder to add tags to your links.
- utm_source=facebook
- utm_medium=social
- utm_campaign=spring_sale
Now, when you look at analytics, you’ll see exactly which post worked.
The "On-Platform" Story
GA4 only tracks what happens after they click. To understand the full story, you need to look at the social platform's own analytics (like Meta Business Suite).
- Likes are vanity.
- Comments are conversation.
- Shares are reputation.
- Saves are the highest form of flattery—it means your content is so good, they want to keep it.
Step 5: The Cycle of Continuous Optimization
Data isn't just for reporting to your boss; it's for learning.
The Strategy Loop:
- Listen (GSC): Find out what people are searching for but not finding.
- Create: Write amazing content that answers those specific questions. Use natural language, not robotic keyword stuffing.
- Distribute: Chop that content up for social media. Use UTMs to track it.
- Analyze (GA4): Did they read it? Did they engage?
- Optimize: If the traffic was high but engagement low, rewrite the intro. If engagement was high but traffic low, rewrite the title
The Final Word
Don't get lost in the spreadsheets. Remember that behind every "User ID" and every "Click" is a real human being looking for an answer. The tools—GA4 and Search Console—are just there to help you listen to them better.
Stop guessing. Start measuring. And watch your traffic grow. The digital landscape keeps changing, but as history reminds us when they said radio would kill print too, surviving AI in 2026 is just about adapting your tools and metrics.

")

